Climate Science · Energy Transition · Ocean Science
The Levers and the Current
A scorecard of what is actually cutting emissions, what isn’t, and how a closed strait is rewriting the odds for the Atlantic.
Curated and edited by Lisa Pedrosa · Researched and drafted with Claude (Anthropic)
One is a shipping lane that, before this year, carried about a fifth of the world’s oil and liquefied natural gas. The other is a slow conveyor of ocean water that keeps northern Europe mild. For a century they had nothing to do with each other. In 2026 they have been dragged into the same story — the story of whether the world is finally pulling the levers that matter.
The honest version of that story is a scorecard. Some levers are working far better than anyone predicted. Some are failing in plain sight. And one — the closure of the Strait of Hormuz — is doing something no climate summit managed: making fossil fuels expensive and unreliable at the exact moment their replacements are cheap and homegrown. It is also, awkwardly, sending parts of Asia back to coal. This piece rates all of it.
One caveat up frontNo climate lever acts on the Atlantic directly. Every one of them works the same way: emissions → warming → Greenland melt → a weaker current. So the ratings below measure how much each lever bends that chain, and how well it is actually being pulled.
I · The stakes
The current is already slowing
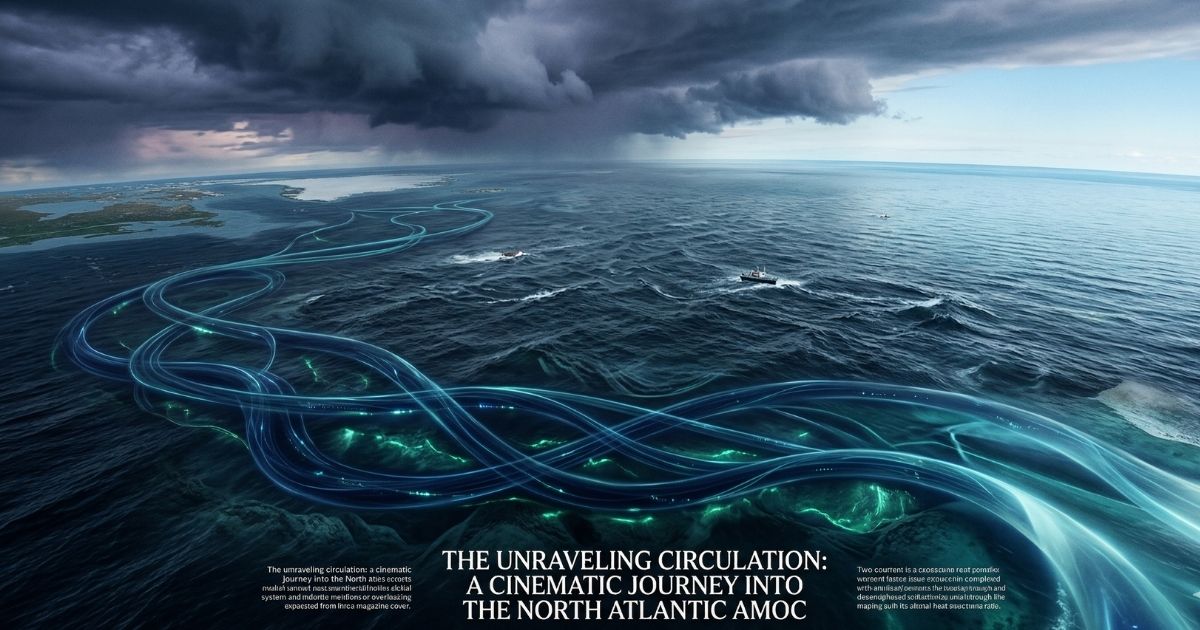
The Atlantic Meridional Overturning Circulation — the AMOC — carries warm, salty water north from the tropics, where it cools, sinks and flows back south at depth. It is one of the main reasons northern Europe is not as cold as its latitude would suggest. Continuous direct monitoring of it only began in 2004, which is part of why scientists still argue about it.
Two studies in April 2026 sharpened the picture. A University of Miami team published in Science Advances on 8 April that four ocean-monitoring arrays along the western edge of the Atlantic, spanning roughly 16.5°N to 42.5°N, all show a decline over about two decades.↗ The eastern side appears to compensate by strengthening, but not enough to offset the loss, so the net circulation is still weaker. The authors do not say collapse is imminent. A week later, a second Science Advances study that weighted climate models by how well they match real ocean observations concluded the AMOC is on course to weaken by more than half by 2100 — stronger than the average of all models — and that the gloomiest models are “unfortunately the realistic ones,” in the words of Stefan Rahmstorf, who was not an author.↗ Greenland meltwater is poorly represented in those models, so the real figure could be worse.
Weakening is settled. Collapse is not.
This is the part of the debate most headlines flatten. The studies below disagree about whether the current switches off, not about whether it is weakening.
Study
What it found
How to read it
Holden et al., Open University (July 2026)
A 10–23% probability that collapse is already “committed”, depending on how much Greenland meltwater is assumed.↗
Large ensembles of Earth-system model runs. Reported via the press at the time of writing.
Baker et al., Met Office / Exeter, Nature (Feb 2025)
None of 34 models showed a total shutdown before 2100; Southern Ocean winds keep a weakened current running.↗
The main counter-evidence. Its own lead author called it “no greenlight for complacency”: weakening is very likely.
A tipping point sometime between 2025 and 2095, most likely around 2057.↗
Statistical, not model-based; criticised by Met Office scientists as overstating certainty.
IPCC AR6
Abrupt collapse before 2100 judged “very unlikely”, with medium confidence.
The official baseline the newer papers are pushing against.
Fig. 1 — Four views on the same current. All agree it is weakening.
If you want the longer physical explanation, we covered the mechanism in AMOC on the Brink. What matters here is the dependency: the severity of the weakening, and the odds of a tipping point, track how much warming and Greenland melt we lock in over the coming decades. That is where the levers come in.
Fig. 2 — Policy touches only the first link. The rest is physics.
II · The thermometer
Where the levers have left us
On 21 October the UN Environment Programme published its Emissions Gap Report for 2026, subtitled “The Point of Return.” Its central finding is blunt: holding warming to 1.5°C with only a limited overshoot is no longer possible. The best remaining scenario peaks at 1.7–1.8°C around mid-century and then pulls back to 1.5°C by 2100, with only a 50% chance of success.↗
2.8°Cwarming by 2100 if current policies simply continue
2.6°Cif every national pledge (NDC) is delivered
2.1°Cif pledges plus all net-zero targets are delivered
+0.1°Cadded to peak warming for every five years of emissions at today’s level
Fig. 3 — UNEP Emissions Gap Report 2026. First three bars: warming by 2100. Bottom bar: peak mid-century warming on the lowest possible 1.5°C-return path, which also needs about 320 Gt of CO₂ removed this century.
The gap is not mysterious. Even if every NDC is fully delivered, global emissions fall only 5–8% by 2030 and 11–15% by 2035 compared with 2025. The return pathway needs 18% by 2030, 45% by 2035 and 69% by 2040.↗ UNEP also notes that its projections are worse than last year’s partly because of the United States’ withdrawal from the Paris Agreement.
One modelling result ties this directly to the Atlantic. Utrecht University researchers, as reported, found that avoiding an AMOC collapse in a low-emission scenario would require reaching net zero around 2050 — and even then, two of the 25 models they tested still collapsed.↗ The 2.8°C world we are heading for is nowhere near that path.
“The growth rate of renewable technologies has surprised many.”
Michel den Elzen, PBL Netherlands Environmental Assessment Agency · UNEP Emissions Gap Report 2026, 21 October 2026
III · The scorecard
Ten levers, rated
How to read the ratingsThe two ratings are an editorial judgement drawn from the evidence cited, not a published index. Potential impact is how much the lever could change warming if fully pulled. Delivery is how well it is actually being pulled today.
Lever
Potential impact
Delivery
The evidence
Solar & wind build-out
High
Strong
A record 814 GW of solar and wind added in 2025 (Ember). Since Paris, renewable capacity has grown three times faster than anticipated and solar PV seven times faster (UNEP).
Electric vehicles
High
Strong
More than 20 million sold in 2025; about 23 million, nearly 30% of new cars, expected in 2026 (IEA).
Forest protection (Brazil)
Medium
Strong
Amazon clearing fell 41.8% to 3,335 km² between August 2025 and July 2026 — the lowest since satellite records began in 1988 (INPE).
Price-based policy mixes
Med–High
Partial
Of 1,500 policies studied across 41 countries, only 63 delivered major cuts — averaging 19% — and those combined price signals with other measures.
China’s emissions plateau
High
Partial
CREA: 2025 emissions about 0.3% lower. 2026 is noisy: Carbon Brief logged a 2% rise early in the year, then a 1% fall in Q2 as oil use dropped.
Methane cuts
Med–High
Promises > action
Energy-sector methane stayed at 124 Mt in 2025. Pledges cover ~80% of fossil production, yet policies cut only 25% by 2035 (IEA).
National pledges (NDCs)
High
Weak
5–8% cuts by 2030 if fully delivered, versus 18% needed (UNEP).
Fossil-fuel phase-out diplomacy
High
Failed so far
COP30 in Belém: 80+ countries backed a roadmap; the final text did not mention fossil fuels at all. Brazil launched voluntary roadmaps outside it.
Coal
High
Backsliding
Coal supply investment hits $180B in 2026, the highest since 2012, about 70% of it in China (IEA). Global power-sector CO₂ forecast to rise ~1% in 2026.
US federal climate policy
High
Backsliding
UNEP attributes part of this year’s worse projections to the US exit from Paris.
Fig. 4 — The scorecard. Sources in the list at the end.
The pattern is clear once you read down the delivery column. What is working is boring, specific and cheap: panels, batteries, cars, a government that enforces the law on illegal clearing. What is failing is big, global and voluntary: pledges, roadmaps, summit communiqués.
814 GWsolar and wind added worldwide in 2025, a record
−41.8%Amazon deforestation, Aug 2025–Jul 2026
63 / 1,500climate policies that delivered major emission cuts
$180Bcoal supply investment in 2026, highest since 2012
IV · What worked, and why
The boring things
Price signals, paired with something else. A study in Science examined 1,500 climate policies across 41 countries between 1998 and 2022 and found just 63 that produced large emission cuts, averaging 19%. The lesson its lead author drew was that more policies do not mean better outcomes: subsidies or regulation alone were not enough, and the successes combined them with tax or price incentives.↗ Bans on coal plants or petrol cars did not deliver big cuts when used alone; Britain’s coal exit and Norway’s electric cars worked because prices moved too. UNEP’s 2026 report reaches a similar place, noting emissions-trading schemes and carbon taxes cutting emissions by roughly 5–13% across the sectors examined.
Cheap electrons. The IEA counts $2.155 trillion of clean-energy investment against $1.008 trillion in fossil fuels in 2025.↗ The 2026 edition expects oil investment to fall below $500 billion, a third straight yearly decline, while spending on electricity grids rises about 20% to roughly $550 billion.↗
Fig. 5 — Clean energy now draws roughly twice the investment of fossil fuels.
Enforcement where it counts. Brazil’s record low in Amazon clearing followed a relaunched anti-deforestation plan and tougher penalties for environmental crime. Nearby, the Cerrado savanna fell by more than a fifth.↗ It is a reminder that a single government with political will can move a number the whole planet cares about. Caveats: thousands of square kilometres were still cleared, agriculture drives almost all of Brazil’s vegetation loss, and wildfires rose by a third over part of the same period, according to one monitoring group.
V · What didn’t
The promises
The COP30 fossil roadmap. More than 80 countries, including exporters such as Norway, backed a roadmap to phase out fossil fuels at the Belém summit. Russia, Saudi Arabia, India and others blocked it, and the final decision did not contain a single reference to fossil fuels.↗ Brazil said it would pursue voluntary roadmaps on fossil fuels and deforestation outside the formal text. Adaptation finance, by contrast, was agreed to triple by 2035.
Methane — the cheapest lever, untouched. This one is genuinely frustrating. The IEA says around 70% of fossil-fuel methane emissions can be abated with existing technology, and more than 30% could be avoided at no net cost because the captured gas is worth more than the fix. Pledges now cover about 80% of fossil production. Yet emissions are flat, and existing policies would cut only 25% by 2035.↗
Coal, and the net. Coal investment is climbing while the clean-energy numbers boom. The two are not contradictory; they are happening in different places. And UNEP’s lowest-overshoot pathway quietly depends on a lever that barely exists yet: removing roughly 320 gigatonnes of CO₂ from the atmosphere this century, equal to about eight years of 2024’s global emissions.
VI · The strait
The lever nobody chose to pull
On 28 February 2026, US and Israeli strikes on Iran began a war that effectively closed the Strait of Hormuz. Before the war, roughly a fifth of the world’s oil consumption and a similar share of its LNG passed through it. In March the IEA organised its largest-ever emergency release of oil stocks, 400 million barrels, and oil prices rose by more than 60% in the month.↗ LNG prices in Asia doubled.↗
Status as of 27 October 2026The strait remains effectively closed. A live tracker counted day 239 on 25 October. In late September Iran offered to reopen it within a week if the US lifted its naval blockade and waived oil sanctions; the US rejected the proposal on 26 September. Reports of a fresh Iranian offer this week were denied by Iranian state media, and Iran’s foreign minister has said management of the strait will not return to pre-war norms. This is a fast-moving situation: check current reporting.
Fig. 6 — The 2026 Hormuz crisis. Dates compiled from multiple news and tracking sources; the reopening window is approximate.
Prices followed a roller-coaster, not a straight line. Forecasters in the spring warned of Brent at $100 and above, and it did spike in that range. After the June memorandum reopened the strait, it fell back to about $71 a barrel by early July. Then the ceasefire collapsed and the blockade returned. The lesson: markets price the expectation of supply as much as the supply itself.
Did the shock push the transition?
The IEA’s executive director, Fatih Birol, described it in May as “the largest energy security crisis the world has ever faced” and compared its likely effect on investment to the aftermath of the 1970s oil shocks.↗ The evidence so far points both ways.
It accelerated the shift
EV sales rose 35% in Q2 over Q1 and hit record highs in 50 countries as fuel prices spiked (IEA).
IEA expects oil investment to fall for a third straight year despite high prices.
Clean investment helped the five biggest fuel-importing regions avoid about $260B in fossil imports in 2025.
Wood Mackenzie says EV cost parity could arrive by 2027 even at $150 Brent.
China’s emissions fell about 1% in Q2 2026 as its oil use dropped.
In Nepal, electric cars are about three-quarters of new sales.
It sent parts of Asia back to coal
With LNG scarce, India burned more coal; South Korea lifted caps on coal power; Indonesia, Thailand, the Philippines and Vietnam boosted coal generation (AP, March).
Taiwan considered restarting a decommissioned coal plant.
About $107B of South Asian LNG infrastructure is at risk, per Global Energy Monitor.
The IEA forecasts record power-sector CO₂ in 2026.
Africa receives only about 3% of global energy investment; higher borrowing costs hit poorer countries hardest.
Read together: a ratchet that turns both ways in the short run and one way in the long run. Coal is the emergency fix. Electrification is the lasting response, because a solar panel or an electric car cannot be blockaded. History supports that reading: the oil shocks of the 1970s led to the creation of the International Energy Agency itself. Whether 2026 does the same depends on what governments do with the next two years, not on the strait.
VII · The sum
What it adds up to
The Atlantic current is weakening, and nothing a government does this year changes that. What governments choose over the next two decades sets how far it goes. The good news is that the cheapest, fastest tools are now the market leaders: solar, wind, batteries, electric cars. The bad news is that the slow, hard, political tools — phasing out coal, cutting methane, ending subsidies, pricing carbon — are the ones still stuck.
The closure of Hormuz is not a climate policy, and nobody should pretend it is a strategy. It is a very expensive demonstration of a point climate scientists have made for decades: dependence on a few chokepoints for fossil energy is a vulnerability, and the alternatives exist. UN Secretary-General Antonio Guterres has put the same conclusion in a single line: the emissions gap is now a leadership gap..
What to watch next
The strait. Whether the US–Iran standoff produces a deal, and whether oil importers lock in EV and renewable policies before prices fall again.
The next UN climate summit. Whether the voluntary fossil-fuel roadmap gets any real backing.
China’s 2026 total. The quarter-by-quarter numbers are noisy; the full-year figure matters.
The Atlantic. New observations from the monitoring arrays, and how the AMOC debate absorbs the Holden and Baker results.
Sources
Atlantic current
University of Miami (Xing et al.), “Meridionally consistent decline in the observed western boundary contribution to the AMOC,” Science Advances, 8 April 2026, DOI 10.1126/sciadv.adz7738 — ScienceDaily summary
CNN, “A vital system of Atlantic Ocean currents is weakening…”, 16 April 2026 — republished at KVIA
Arctic Today, “AMOC collapse may already be locked in, new study suggests”, 8 July 2026 — link
Baker et al., Nature 638 (2025); Met Office release, 26 February 2025 — link
Smithsonian Magazine on Ditlevsen & Ditlevsen, Nature Communications (2023) — link
Emissions and policy
UNEP, Emissions Gap Report 2026: The Point of Return, 21 October 2026 — PBL summary
How this piece was made
I chose the question and steered the angle. The research and drafting were done with Claude, an AI model made by Anthropic. Every figure, quote and link was checked against its source before publishing, and the Strait of Hormuz section reflects the situation on the date shown. Credit where it’s due.
Curated and edited by Lisa Pedrosa · Researched and drafted with Claude (Anthropic). How topics are chosen, how AI is used and how every figure, quote and link is checked is set out in the editorial policy.



 Buy me a coffee